VSL - North Portal
VSL procured Qflow to undertake development, and work began on-site in January 2022 and completed in December 2022.
Introduction
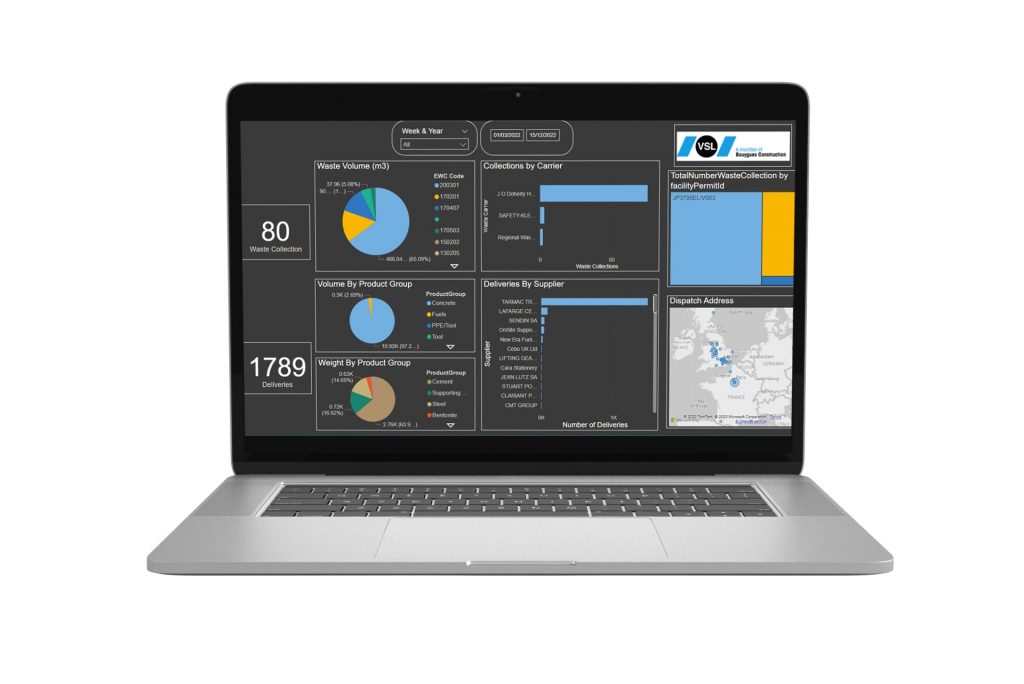
Qflow is used on the VSL North Portal project to digitise all waste and delivery tickets arriving onto site as part of VSL operations. The real-time waste and delivery data is then displayed in a dashboard for the VSL site team to use. The Qflow app is used to scan in both waste transfer notes and delivery tickets.
The Data
The data captured by the Qflow system is exported to a Power BI dashboard. This dashboard shows the total number of deliveries and waste movements across the VSL North Portal project. The dashboard also shows scope 1 and scope 3 carbon emissions.
Calculating Scope 3 Carbon Emissions
The connection to Power BI has allowed the data to be displayed in a way that gives most value to the site teams.This data also allows scope 1 and scope 3 carbon emissions to be tracked in real time.
One Source of Truth
All waste and delivery tickets are stored in one central location that is easily accessible by all members of the site team.

Download full Case Study here
Speak with our expert sales team to book a demo
Enabling responsible, resource efficient construction; cutting waste and carbon. Qflow automates on site data capture and auditing, feeding it into your existing tools
Get your free sustainability score today
Take our 2-minute quiz and we’ll send you a free report showing your sustainability readiness and what you can do to track, measure and reduce as-build project carbon

