Introducing the Qflow Utilities Module: Easier Tracking, Smarter Insights
Every drop of water. Every kilowatt of electricity. They all add up. But the real danger? Not knowing where your resources are going.
Right now, understanding utility consumption data is a serious challenge on many construction projects. Scattered PDFs, blurry images, inconsistent spreadsheets—it’s a mess. And that mess is costs time, money and accuracy. Worst of all, it’s keeping you blind to your real carbon impact.
Managing utility data shouldn’t be frustrating or time-consuming. With Qflow’s new Utilities Module, you can now easily track water and electricity usage directly in the platform. This means clearer data, smarter insights, and more accurate carbon reporting.
Why This Matters
Utility tracking has long been a challenge. Without structured data, measuring energy and water usage accurately is a lengthy process that’s prone to errors. Sustainability teams and subcontractors need simple and effective tools that integrate into their existing workflows. That’s why we built the Utilities Module—to simplify input, connect the dots across materials, waste, and utilities, and provide a complete picture of A1-A5 scope carbon emissions.
How it Works
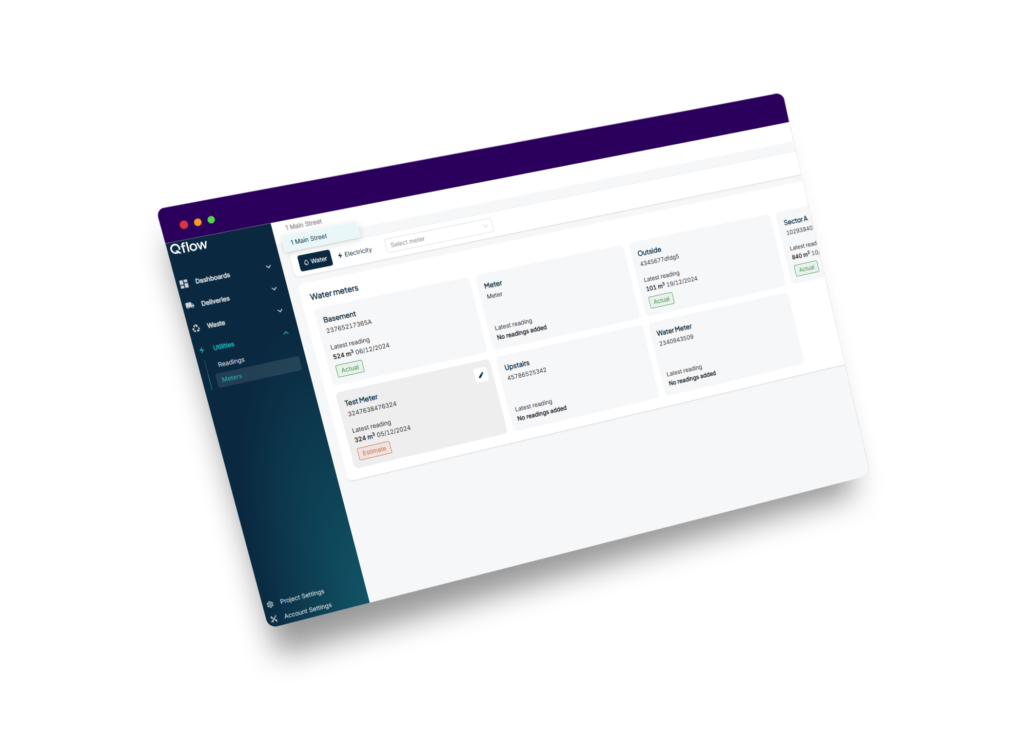
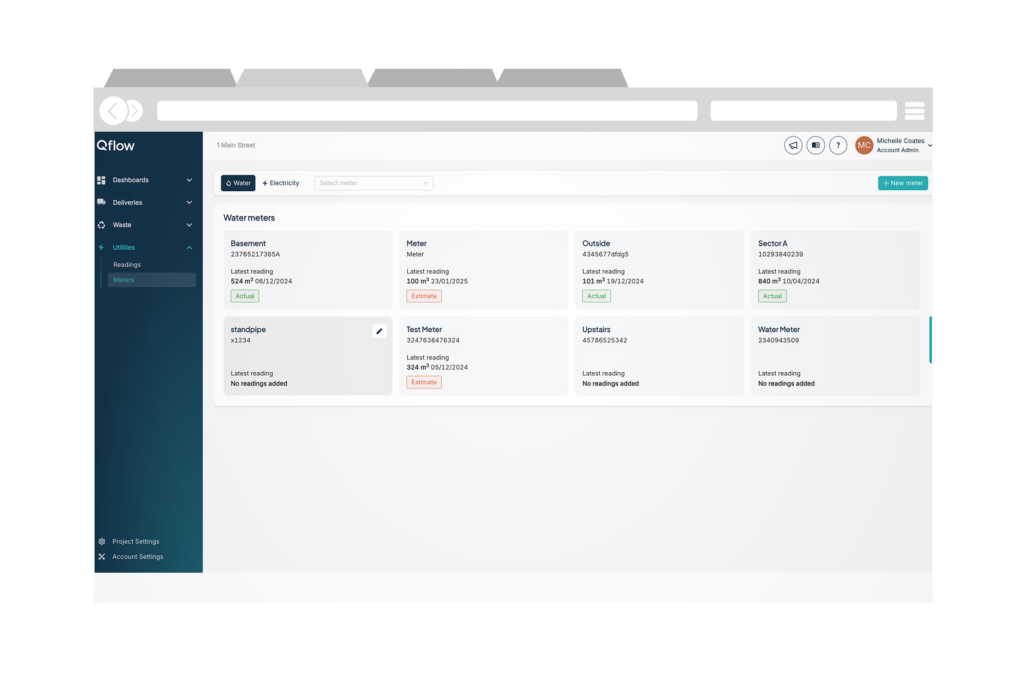
Simplify utility tracking and get a full view of carbon emissions.
- Easy Data Entry: Input water and electricity meter data straight into Qflow—no more PDFs or blurry image uploads.
- Smarter Insights: Integrate utility usage with waste and material data for accurate carbon insights.
- Complete Carbon Reporting: Qflow now captures Scope 2 emissions, giving a full view of sustainability impacts.
- Seamless Integration: Works effortlessly within your existing Pro or Enterprise projects.
- Ditch the spreadsheets and get structured utility data for better analysis and reporting.
Who Benefits?
If you’re responsible for sustainability reporting, juggling multiple data sources, or simply tired of chasing down utility information, this is your moment to take back control.
Whether you’re a sustainability manager, site team, or subcontractor, you now have the data-driven insights you need to optimise resource use and reduce environmental impact.
The Bigger Picture
With the Utilities Module, Qflow now supports full Scope 1-3 emissions reporting. This means a more complete, data-backed approach to sustainability—because tackling carbon footprints should be about real action, not guesswork.
Ready to Simplify Utility Tracking?
Get started today—talk to your Customer Success Manager or book a demo now!
